
Ever feel like you’re missing something when trying to figure out why certain situations turn risky? It’s often about the details – where things happen, when they happen, and who’s involved. That’s where this new tool comes in handy. It’s called the Trigger Mapping Toolkit, and it helps you put all those pieces together. Think of it as a way to map out the ‘triggers’ that lead to problems, so you can get a better handle on things before they get out of hand.
Key Takeaways
- The Trigger Mapping Toolkit helps you understand risky situations by looking at location, time, and people involved.
- Geotagging shows you exactly where problems tend to happen, making it easier to spot patterns.
- Clocktagging tracks when risks are more likely, helping you see connections over time.
- People-tagging focuses on social connections and how they play a part in risk.
- Combining all these tags gives a fuller picture, leading to smarter ways to prevent issues.
Unlocking Contextual Understanding With The Trigger Mapping Toolkit
The Power of Contextual Data
We often look at risks as isolated events. A security breach, a public health outbreak, a natural disaster – these are the headlines. But what if we could see the smaller pieces that lead up to them? Understanding the context surrounding these events is key. Think about it: knowing where something happened, when it happened, and who was involved can paint a much clearer picture than just knowing that it did happen. This kind of detailed information helps us move beyond just reacting to problems and start thinking about how to prevent them in the first place. It’s about connecting the dots.
Introducing the Trigger Mapping Toolkit
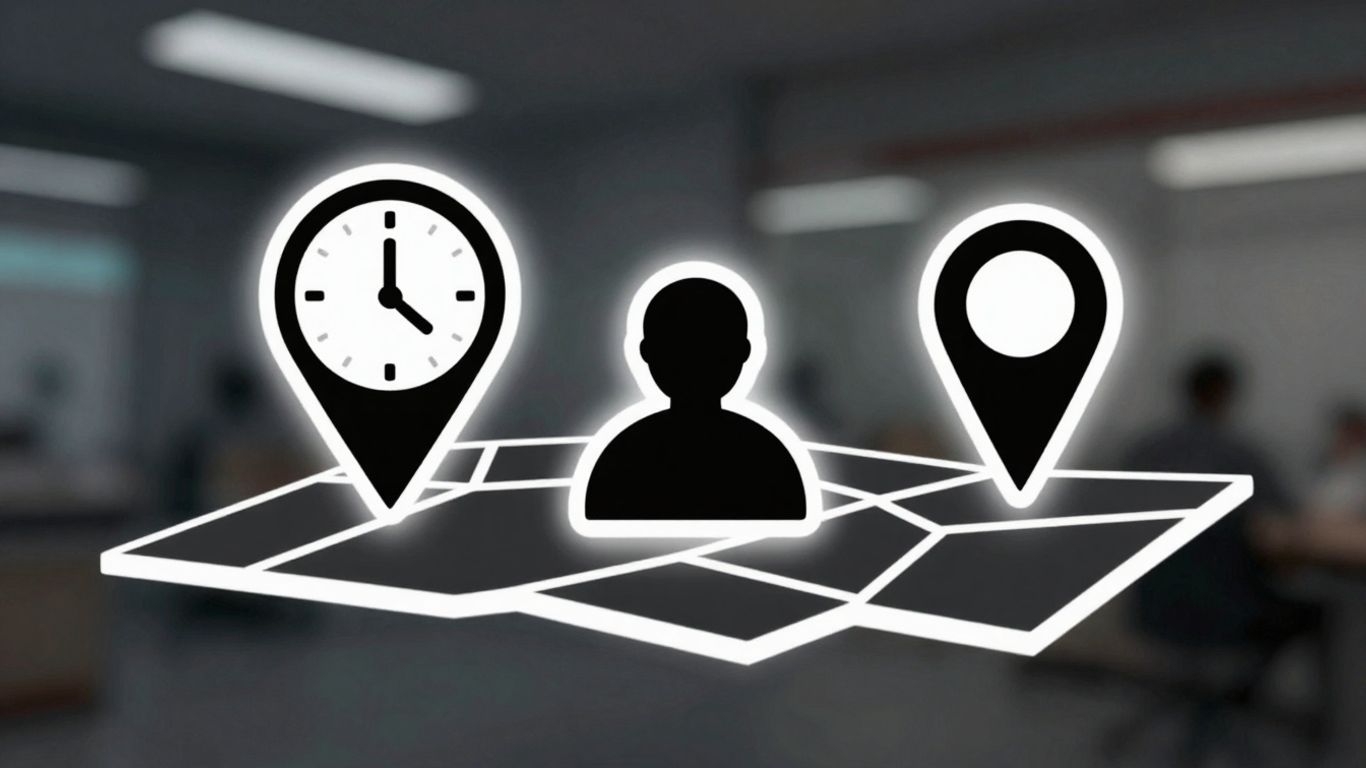
This is where the Trigger Mapping Toolkit comes in. It’s a new way to gather and organize information about risky situations. We’ve broken it down into three main parts: geotagging, clocktagging, and people-tagging.
- Geotagging: This is about location. Where did the event or potential risk occur? Pinpointing exact spots helps us see patterns on a map.
- Clocktagging: This focuses on time. When did things happen? Was it a specific time of day, a certain day of the week, or during a particular season?
- People-tagging: This looks at the human element. Who was involved? What were their roles, relationships, or connections?
By combining these three types of data, we get a much richer understanding of what’s going on.
Enhancing Risk Assessment Through Granular Data
Traditional risk assessments can sometimes be a bit too broad. They might tell you a general area is high-risk, but not why or when it’s most risky. The Trigger Mapping Toolkit changes that. It allows us to collect very specific details – granular data – about incidents and potential threats.
This detailed approach means we can identify not just that a risk exists, but the specific conditions that make it more likely to occur. It’s like going from a blurry photograph to a high-definition image.
For example, instead of just saying a neighborhood has a high crime rate, we can see that crime spikes on Friday evenings near a specific park (geotag + clocktag) and often involves a particular group of individuals (people-tag). This level of detail is what allows for truly effective risk management.
Geotagging Your Risky Environments
When we talk about risky situations, the ‘where’ is often just as important as the ‘what’ or ‘who’. That’s where geotagging comes in. It’s about precisely marking the spots where risks tend to pop up. Think of it like putting pins on a map, but instead of tourist attractions, you’re marking areas that have a history of problems or potential dangers.
Pinpointing Locations of Concern
This is the first step. We need to know exactly where these risky places are. It could be a specific intersection known for accidents, a neighborhood with a high crime rate, or even a particular building where safety issues have occurred. By collecting and recording the geographic coordinates of these incidents or potential hazards, we start building a clear picture of the physical landscape of risk.
- Accurate location data is key.
- We gather data from incident reports, sensor readings, or even community feedback.
- This information is then mapped using GPS coordinates.
Analyzing Spatial Risk Patterns
Once we have our pins on the map, we can start looking for patterns. Are the risky locations clustered together? Do they form lines along certain roads? Are they concentrated in specific types of areas, like industrial zones or public parks? Looking at these spatial patterns helps us understand if there are underlying environmental or infrastructural factors contributing to the risk. For example, a cluster of traffic accidents might point to a poorly designed intersection or inadequate signage.
| Risk Type | Number of Incidents | Geographic Cluster | Primary Contributing Factor (Hypothesized) |
|---|---|---|---|
| Traffic Accidents | 150 | Downtown Core | High traffic volume, poor visibility |
| Petty Theft | 85 | Entertainment District | High foot traffic, limited police presence |
| Vandalism | 40 | Industrial Park | Poor lighting, lack of security patrols |
Visualizing Geographic Triggers
Seeing the data laid out visually makes a huge difference. Maps that show the density of incidents, or highlight areas with multiple types of risks, can reveal connections that might be missed in spreadsheets. These visualizations act as a powerful communication tool, helping everyone from field operators to decision-makers quickly grasp where the problems are most concentrated and what the geographic triggers might be. It’s about making the invisible visible, turning raw data into actionable insights about our physical surroundings.
Visualizing risk on a map transforms abstract data into a tangible, understandable form. It allows us to see the ‘hotspots’ and understand the spatial relationships that might otherwise remain hidden. This clarity is vital for planning effective interventions and allocating resources where they are most needed.
Clocktagging Temporal Risk Factors

Beyond just where something happens, when it happens is often just as important for understanding risk. Think about it: a security breach at 3 AM is a different beast than one at 3 PM. The Trigger Mapping Toolkit’s clocktagging feature lets us get really specific about time. We can pinpoint not just the day, but the hour, or even minute, when a risky event occurred. This isn’t just about creating a timeline; it’s about seeing patterns that only emerge when you look closely at the clock.
Identifying Time-Sensitive Risks
Some risks are tied to specific times of day, days of the week, or even seasons. For example, a retail store might see a spike in shoplifting during holiday shopping hours, or a construction site might face increased risks of accidents during extreme weather events that typically occur in the afternoon. Clocktagging helps us flag these periods. We can see when certain types of incidents are more likely to pop up.
Understanding Event Timelines
When multiple events are connected, the order and timing matter a lot. Was the power outage the cause of the system failure, or did the system failure lead to the outage? By accurately clocktagging each event, we can start to build a clearer picture of cause and effect. This helps us move beyond just knowing what happened to understanding how it unfolded.
Correlating Time and Incident Occurrence
This is where things get really interesting. We can start to see how different factors align with specific times. For instance, are there more traffic accidents on Friday evenings? Do certain types of cyberattacks happen more frequently overnight? By plotting incidents against time, we can spot these correlations. This allows us to anticipate when and where risks are most likely to manifest.
Here’s a simple look at how we might track incident frequency by hour:
| Hour of Day | Number of Incidents |
|---|---|
| 00:00 – 03:00 | 15 |
| 03:00 – 06:00 | 22 |
| 06:00 – 09:00 | 45 |
| 09:00 – 12:00 | 60 |
| 12:00 – 15:00 | 55 |
| 15:00 – 18:00 | 70 |
| 18:00 – 21:00 | 50 |
| 21:00 – 00:00 | 30 |
Analyzing temporal data helps us understand the rhythm of risk. It’s like listening to the heartbeat of a system to detect irregularities before they become serious problems. This temporal awareness is key to shifting from reacting to problems to preventing them.
Clocktagging isn’t just about recording timestamps; it’s about using time as a lens to view risk more clearly. It helps us see the ebb and flow of potential dangers, allowing for more precise and timely interventions.
People-Tagging Social Dynamics and Risk
Mapping Social Networks and Influence
When we talk about risky situations, it’s easy to focus on places or times. But people are often at the center of it all. Understanding who is connected to whom, and how influence flows, can give us a much clearer picture of potential problems. Think about it: a rumor can spread like wildfire, or a key individual might be able to de-escalate a tense situation. Mapping these social connections, even informally, helps us see the human element in risk.
- Identifying key influencers: Who are the people others listen to?
- Tracking information flow: How do messages or sentiments spread through a group?
- Recognizing social hubs: Where do interactions tend to happen?
Understanding Human Factors in Risk
People’s actions, motivations, and even their emotional states play a big role in risk. Sometimes, it’s about group behavior – how a crowd might react under pressure. Other times, it’s about individual choices. By tagging people, we can start to look at patterns in behavior that might signal rising risk. This isn’t about judging individuals, but about seeing how human dynamics contribute to the overall risk picture.
The collective mood of a group can shift rapidly, sometimes without a clear external cause. Recognizing these subtle shifts in sentiment or behavior is key to anticipating trouble before it starts.
Identifying Key Stakeholders and Interactions
In any given context, there are usually different groups of people involved. Some might be directly affected, others might have the power to change things, and some might be observers. Identifying these stakeholders and understanding how they interact is important. Are there conflicts brewing between groups? Are certain interactions more likely to lead to problems? This kind of mapping helps us see the social architecture of a situation.
Here’s a simple way to think about it:
- Primary Actors: Those directly involved or causing the situation.
- Secondary Actors: Those who are affected by the situation.
- Tertiary Actors: Those who can influence or mediate the situation.
By paying attention to these social layers, we get a more complete view of the risks at play.
Integrating Geotag, Clocktag, and People-Tag Data
So, we’ve talked about pinpointing places with geotagging, timing events with clocktagging, and understanding who’s involved with people-tagging. But the real magic happens when you start mixing all that information together. It’s like having separate puzzle pieces and then finally seeing how they fit to make a complete picture.
Synergistic Data Fusion for Deeper Insights
When you combine these different types of data, you get a much clearer view of what’s going on. For example, knowing where something happened is useful, but knowing when it happened there, and who was present, gives you a whole new level of understanding. You can start to see patterns that were invisible before. Think about it: a specific location might only become risky at certain times of day, or when particular groups of people are around. This isn’t just about adding numbers; it’s about finding connections.
Building Comprehensive Risk Profiles
By merging geotag, clocktag, and people-tag information, you can build really detailed profiles of risky situations. Instead of just saying ‘this area is risky,’ you can say ‘this area is risky between 10 PM and 2 AM, especially when a certain social group is present.’ This kind of specific information is gold for planning. It helps you move beyond general warnings to very targeted assessments.
Here’s a simple way to think about it:
- Location: A busy downtown street.
- Time: Late Friday night.
- People: A large crowd leaving a concert.
Individually, these points are just facts. Together, they paint a picture of potential congestion, increased demand for services, or even a higher chance of minor incidents.
Uncovering Complex Interdependencies
Often, risks aren’t caused by just one thing. They’re a mix of factors. Geotagging might show a cluster of incidents near a particular building. Clocktagging might reveal these incidents happen mostly on weekends. People-tagging could indicate that individuals from a specific community are often involved. Putting all three together can reveal that the risk isn’t just the building, or the time, or the people, but the interaction between them – perhaps a community event held at that location on weekend nights. This kind of insight is what lets you get ahead of problems before they really start.
The real power comes from seeing how location, time, and social connections influence each other. It’s not enough to know that something is risky; we need to know why and under what specific conditions it becomes risky. This integrated approach moves us from simply reacting to events to understanding the underlying dynamics that create them.
Leveraging the Trigger Mapping Toolkit for Proactive Strategies
From Reactive to Predictive Risk Management
Moving beyond just reacting to incidents, the Trigger Mapping Toolkit lets us get ahead of potential problems. By connecting location, time, and social data, we can start to see patterns that signal rising risk before something happens. It’s about shifting our focus from cleaning up messes to preventing them in the first place. This toolkit gives us the tools to build a more forward-looking approach to safety and security.
Developing Targeted Intervention Plans
Once we have a clearer picture of what triggers risks, we can design specific actions. Instead of broad, one-size-fits-all solutions, we can create plans that address the exact factors contributing to a risk in a particular context. This means our interventions are more likely to work and less likely to waste resources.
Here’s how we can start building these plans:
- Identify High-Risk Zones: Use geotag data to pinpoint areas with frequent or severe incidents.
- Pinpoint Risky Times: Analyze clocktag data to find specific times of day or days of the week when risks are highest.
- Understand Social Factors: Map people-tag data to see how social connections or specific groups might be involved.
- Combine Insights: Look for overlaps where location, time, and social elements converge to create a risk.
Empowering Data-Driven Decision Making
The Trigger Mapping Toolkit transforms raw data into actionable intelligence. It provides a clear, visual way to understand complex situations, making it easier for decision-makers to grasp the nuances of risk. This clarity helps in making informed choices that are grounded in evidence, not just guesswork.
When we can see the connections between where things happen, when they happen, and who is involved, we gain a much better understanding of why they happen. This insight is what allows us to move from simply responding to events to actively shaping a safer future. It’s about using the information we gather to make smarter, more effective decisions that protect people and assets.
Practical Applications of the Trigger Mapping Toolkit
So, you’ve got this Trigger Mapping Toolkit, and you’re probably wondering, ‘What can I actually do with it?’ Well, it turns out, quite a lot. This isn’t just some theoretical exercise; it’s about making real-world differences in how we handle risks.
Enhancing Security Operations
Think about security. Knowing where and when incidents are more likely to happen, and who might be involved, changes everything. Instead of just reacting to events, security teams can start anticipating them. For instance, by geotagging areas with a history of security breaches, you can deploy patrols more effectively. Clocktagging can reveal patterns, like increased activity during specific hours or days, allowing for targeted staffing. People-tagging can help identify individuals or groups associated with past issues, aiding in threat assessment.
- Predictive Patrol Routing: Directing security personnel to high-risk zones during peak times.
- Access Control Refinement: Adjusting entry protocols based on temporal or social risk factors.
- Incident Response Optimization: Pre-positioning resources based on anticipated trigger events.
The ability to map out not just where a problem occurred, but when and who was connected, provides a much clearer picture than simple incident logs. It moves security from a reactive stance to a more proactive one.
Improving Public Health Interventions
Public health is another area where this toolkit shines. Imagine trying to track the spread of an illness. Geotagging can show hotspots, revealing how the disease moves geographically. Clocktagging can highlight periods of increased transmission, perhaps linked to specific events or seasons. People-tagging can help understand social networks that might facilitate or hinder the spread of information about health risks, or even the disease itself.
- Targeted Vaccination Campaigns: Focusing efforts on areas and demographics identified as high-risk.
- Outbreak Monitoring: Quickly identifying the geographic and temporal spread of infectious diseases.
- Public Awareness Campaigns: Tailoring health messages to specific communities and times when they are most needed.
Optimizing Emergency Response Efforts
When disaster strikes, every second counts. The Trigger Mapping Toolkit can help emergency responders get a handle on the situation faster. Geotagging can pinpoint affected areas and map out safe routes for access. Clocktagging can help understand the timeline of an event, like a flood or a wildfire, and predict its progression. People-tagging can identify vulnerable populations or key community contacts who can assist in communication and aid distribution.
- Resource Allocation: Directing ambulances, fire trucks, and aid supplies to the most critical locations.
- Evacuation Planning: Identifying safe zones and optimal routes based on real-time risk data.
- Communication Strategy: Understanding who needs to be informed and how best to reach them during a crisis.
The Future of Contextual Risk Analysis
Advancements in Data Collection and Analysis
The way we gather and make sense of risk-related information is changing fast. Think about it: sensors are getting smaller, cheaper, and way more connected. This means we can collect data from more places, more often. We’re not just talking about security cameras anymore; it’s about environmental sensors, social media chatter, and even wearable tech. The trick is sifting through all this noise. AI and machine learning are getting better at spotting patterns we’d miss. They can process huge amounts of data, finding connections between, say, weather patterns, traffic flow, and public gatherings. This ability to process vast, diverse datasets in near real-time is what will redefine risk assessment. It’s moving from educated guesses to data-backed predictions.
The Evolving Landscape of Risk Management
Risk management used to be about reacting to problems after they happened. Now, the goal is to see them coming. With tools like the Trigger Mapping Toolkit, we’re shifting towards predictive strategies. Instead of just fixing things, we’re trying to prevent them from breaking in the first place. This means looking at all the angles – where things are happening, when they’re happening, and who’s involved. It’s about building a complete picture, not just a snapshot. This proactive approach saves resources and, more importantly, lives.
Embracing the Trigger Mapping Toolkit for Resilience
So, what does this all mean for us? It means we can build stronger, more adaptable systems. Whether it’s for a city planning safer public spaces, a company managing supply chain disruptions, or a health organization tracking disease outbreaks, the toolkit offers a way forward. It helps us understand the ‘why’ behind risky situations, not just the ‘what’.
Here’s a quick look at how different sectors might benefit:
- Urban Planning: Identifying areas with high pedestrian traffic during specific events to improve safety infrastructure.
- Logistics: Predicting potential delays by analyzing weather forecasts, traffic data, and known event schedules.
- Public Health: Mapping disease spread by correlating reported cases with social gathering data and travel patterns.
The real power comes from combining these different data streams. A spike in social media mentions of a certain area, coupled with unusual traffic patterns and a specific time of day, could signal a developing situation long before it becomes a crisis. This integrated view is the next frontier.
Ultimately, the Trigger Mapping Toolkit is about making smarter decisions. It’s about using the information we have to build a safer, more secure future for everyone. It’s not just about avoiding bad things; it’s about creating better conditions overall.
Thinking about how to understand risks better? Our section, "The Future of Contextual Risk Analysis," breaks down complex ideas into simple terms. We explore new ways to look at potential problems and how to prepare for them. Want to learn more about staying ahead of risks? Visit our website today for insights that can help you make smarter choices.
Putting It All Together
So, we’ve looked at how geotagging, clocktagging, and people-tagging can really help you get a handle on risky situations. It’s not about being perfect, but about having a better picture of what’s going on. Think of it like adding details to a map – the more you add, the clearer the path becomes. This toolkit isn’t some magic fix, but it gives you practical ways to spot patterns and make smarter choices. Give it a try, see what you learn. You might be surprised at what you discover about your own routines and the environments you’re in. It’s a simple idea, but it can make a real difference in how you approach things.
Frequently Asked Questions
What exactly is the Trigger Mapping Toolkit?
Think of the Trigger Mapping Toolkit as a special set of tools that helps us understand why bad things might happen. It’s like putting together puzzle pieces to see the whole picture of risky situations. It uses three main ways to gather information: where things are happening (geotag), when they are happening (clocktag), and who is involved (people-tag).
How does ‘geotagging’ help with risky places?
Geotagging is like putting a pin on a map for places that are important or might be risky. It helps us see if certain areas have more problems. By looking at these map points, we can figure out patterns and understand why some places are more dangerous than others. It’s like drawing a map of trouble spots.
What does ‘clocktagging’ mean for timing risks?
Clocktagging is all about the time when things happen. It helps us notice if risks are more likely at certain times of the day, week, or year. We can look at when events occur and see if they are connected to specific times. This helps us understand the rhythm of risky situations.
Why is ‘people-tagging’ important for understanding risks?
People-tagging looks at the humans involved. It helps us understand how people’s relationships, who they talk to, and their actions can play a role in risky events. By mapping out who knows whom and how they interact, we can get a better handle on the human side of risk.
How do geotag, clocktag, and people-tag work together?
These three tools work best when used together! Imagine knowing *where* a problem happened, *when* it happened, and *who* was involved. Combining this information gives us a much clearer and deeper understanding of why the risk occurred. It helps us build a complete story of the situation.
Can this toolkit help prevent problems before they happen?
Absolutely! By understanding the triggers and patterns of risk, we can move from just reacting to problems to predicting them. This means we can create smarter plans to stop risks from happening in the first place, making things safer for everyone.
What are some real-world examples of using this toolkit?
This toolkit can be super useful in many areas. For example, police can use it to improve security by understanding where and when crimes are more likely. Health officials can use it to track diseases better, and emergency responders can use it to plan for disasters more effectively.
What’s next for tools like this?
Technology is always getting better, so these tools will become even smarter. We’ll be able to collect and understand information in new ways. The goal is to make managing risks easier and help communities become stronger and safer in the future.